London to Paris from €44*
Exchangeable as many times as you want with no fee up to one hour before departure.**


Get up to 50% off your train ticket***
If you can be flexible with your travel times, Eurostar Snap is for you. Book a late deal to London, Paris, Brussels, Amsterdam, or Lille and grab a bargain train ticket.
Ideas for your next trip

Train + Hotel packages
Plan your trip from route to room with a Train + Hotel package. Save time, money and hassle by booking everything in one place.
Book packageReady to travel
Get more from Eurostar

Accessible travel
If you need extra assistance when travelling with us, help is available


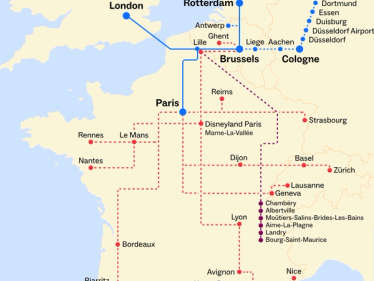
Eurostar Routemap
Check out our route map with direct and indirect routes across France, Belgium, the Netherlands. Germany and the UK.
Find out moreReasons to travel with Eurostar

Make the most of your time on board
Relax and recharge in comfortable seats while enjoying food and drink from the Eurostar Café.

Eurostar for Business
Join our dedicated business portal and enjoy exclusive benefits and partnerships.

Make the most of your travel time
Turn our lounges into a high-speed office or unwind after a hard day’s work.

Out now: the winter edition of Metropolitan magazine
Patisserie trends, Rotterdam gems, and 36 hours in Brussels: Metropolitan is your guide to a wonderful winter.
Read the newest edition (opens in a new tab)Travelling to and from London
*Tickets from €44
See our lowest fare finder for tickets from €44 per person one way based on a mandatory return trip in Eurostar Standard between London St Pancras International and Brussels-Midi/Zuid, Paris, Amsterdam, Rotterdam or Lille, for travel between 24/02/2026 and 05/05/2026. Subject to availability. Availability varies according to dates and times. Blackout dates may apply. The earlier you book, the more availability. Correct as at 13/01/2025.
Travelling between Belgium, France, the Netherlands, and Germany
*Tickets from €35
Price for tickets in Standard class for one way journey made on Eurostar to/from Paris and Amsterdam.
**Flexible tickets conditions
Eurostar Standard & Eurostar Plus tickets can be exchanged free of charge up to 1 hour before the original departure time. If your new ticket is more expensive, you will have to pay the difference. If the new price is cheaper, the difference will not be refunded. Tickets exchanged less than 7 days before the departure date become non-refundable. You can also get a refund up to 7 days before travel for 25€/£.
With Eurostar Premier, you can exchange your tickets or get a refund up to 2 days after travel. If your new ticket is more expensive, you will pay the difference. If your new ticket is cheaper, you will not receive a refund of the difference.
For all our fares, check our after-sales conditions here. Our conditions of carriage are available here.
***Get up to 50% discount off the public price of a Standard ticket 7 days before departure.
Travelling to and from London
*Tickets from €44
See our lowest fare finder for tickets from €44 per person one way based on a mandatory return trip in Eurostar Standard from Brussels-Midi/Zuid to London St Pancras International, for travel between 24/02/2026 and 05/05/2026. Subject to availability. Availability varies according to dates and times. Blackout dates may apply. The earlier you book, the more availability. Correct as at 13/01/2025.
Travelling between Belgium, France, the Netherlands, and Germany
*Tickets from €29
Price for tickets in Standard class for one way journey made on Eurostar to/from Brussels Midi/Zuid, Antwerpen Centraal, Liège Guillemins, Rotterdam Centraal, Schiphol Airport, Amsterdam Centraal. Subject to availability.
**Get up to 50% discount off the public price of a Standard ticket 7 days before departure.


