About us
The whole story, from A to B and beyond
Our company
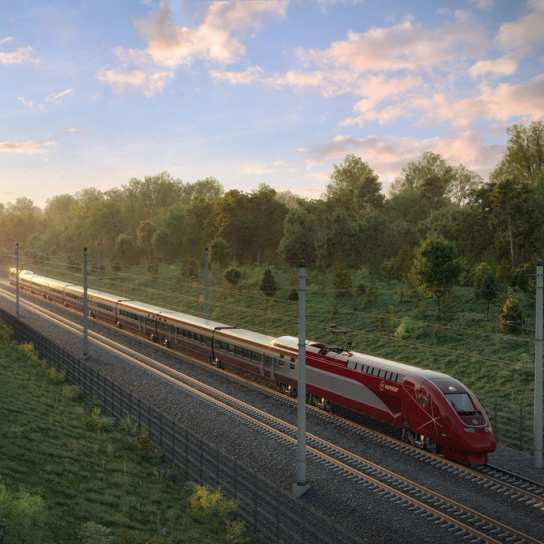
Eurostar and Thalys have joined forces under the Eurostar name, kickstarting an exciting new era for train travel. This means you’ll have the chance to discover the UK, Belgium, France, Germany and the Netherlands on a wider range of high-speed routes.
Eurostar Executive Committee
The people who spend every day working to make your journey better.
Find out more
Eurostar board of directors
Providing the years of experience and expertise to keep Eurostar moving forward.
Find out more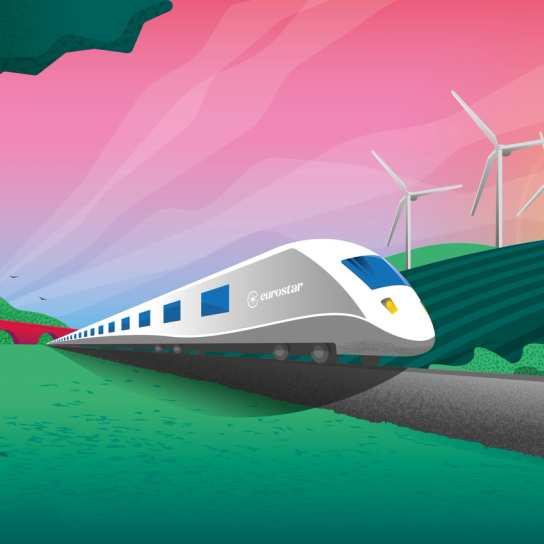
Go greener with Eurostar
Want to know more about the environmental benefits of travelling by train?
Find out more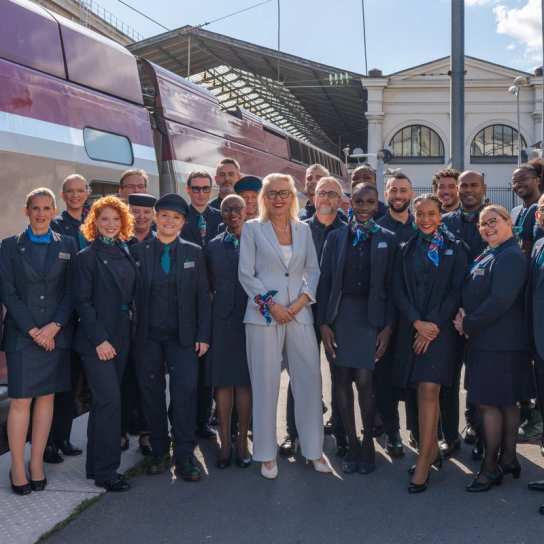
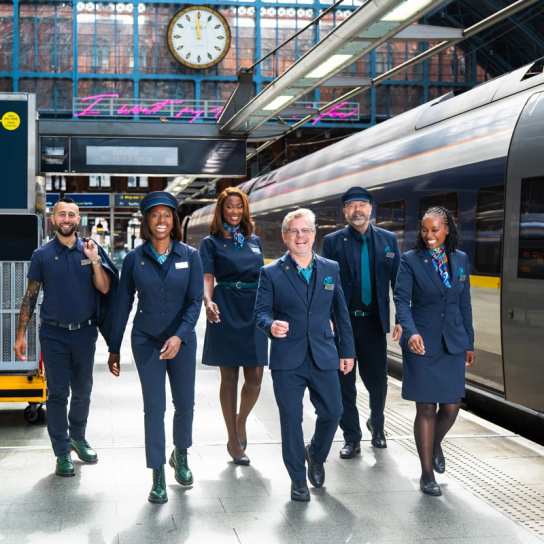
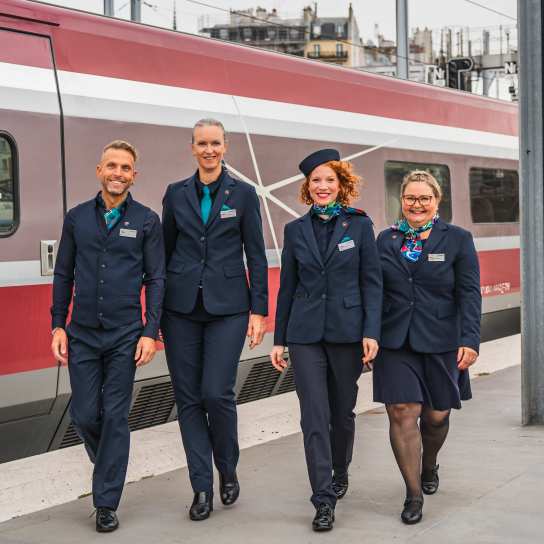
Eurostar and Thalys join forces
How we are coming together with Thalys to create the Eurostar Group.
Find out more